Daily updated charts of Bitcoin's stock-to-flow vs price
Posted on Monday 09 February 2026 in misc
NOTE: This page should not be interpreted as financial advice.
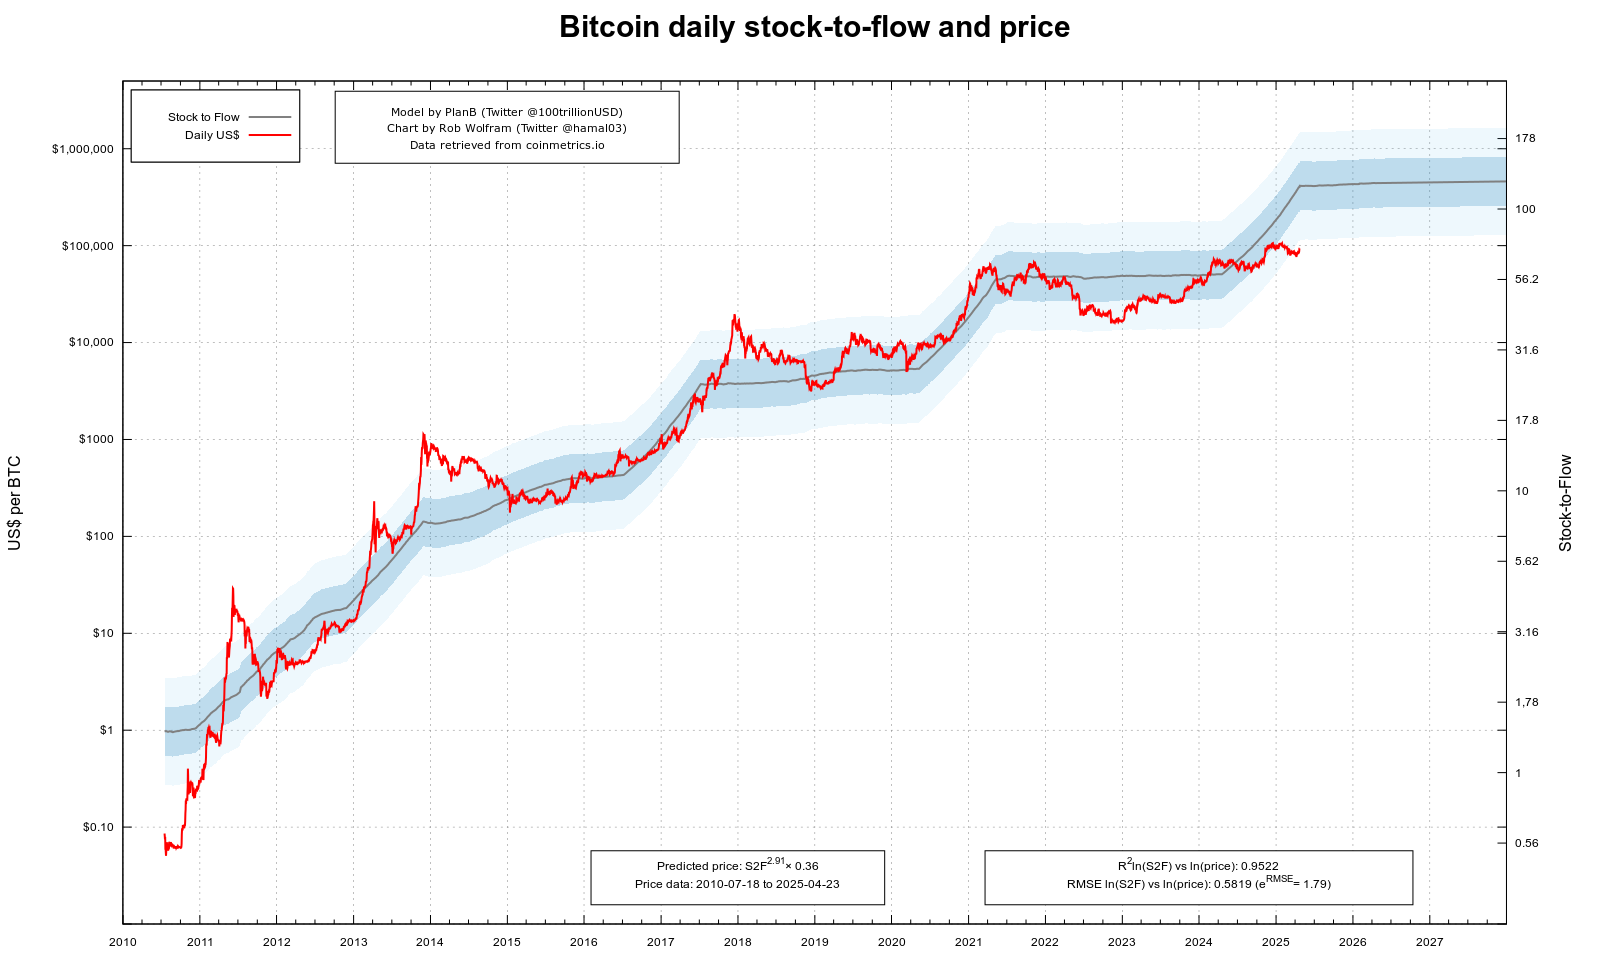
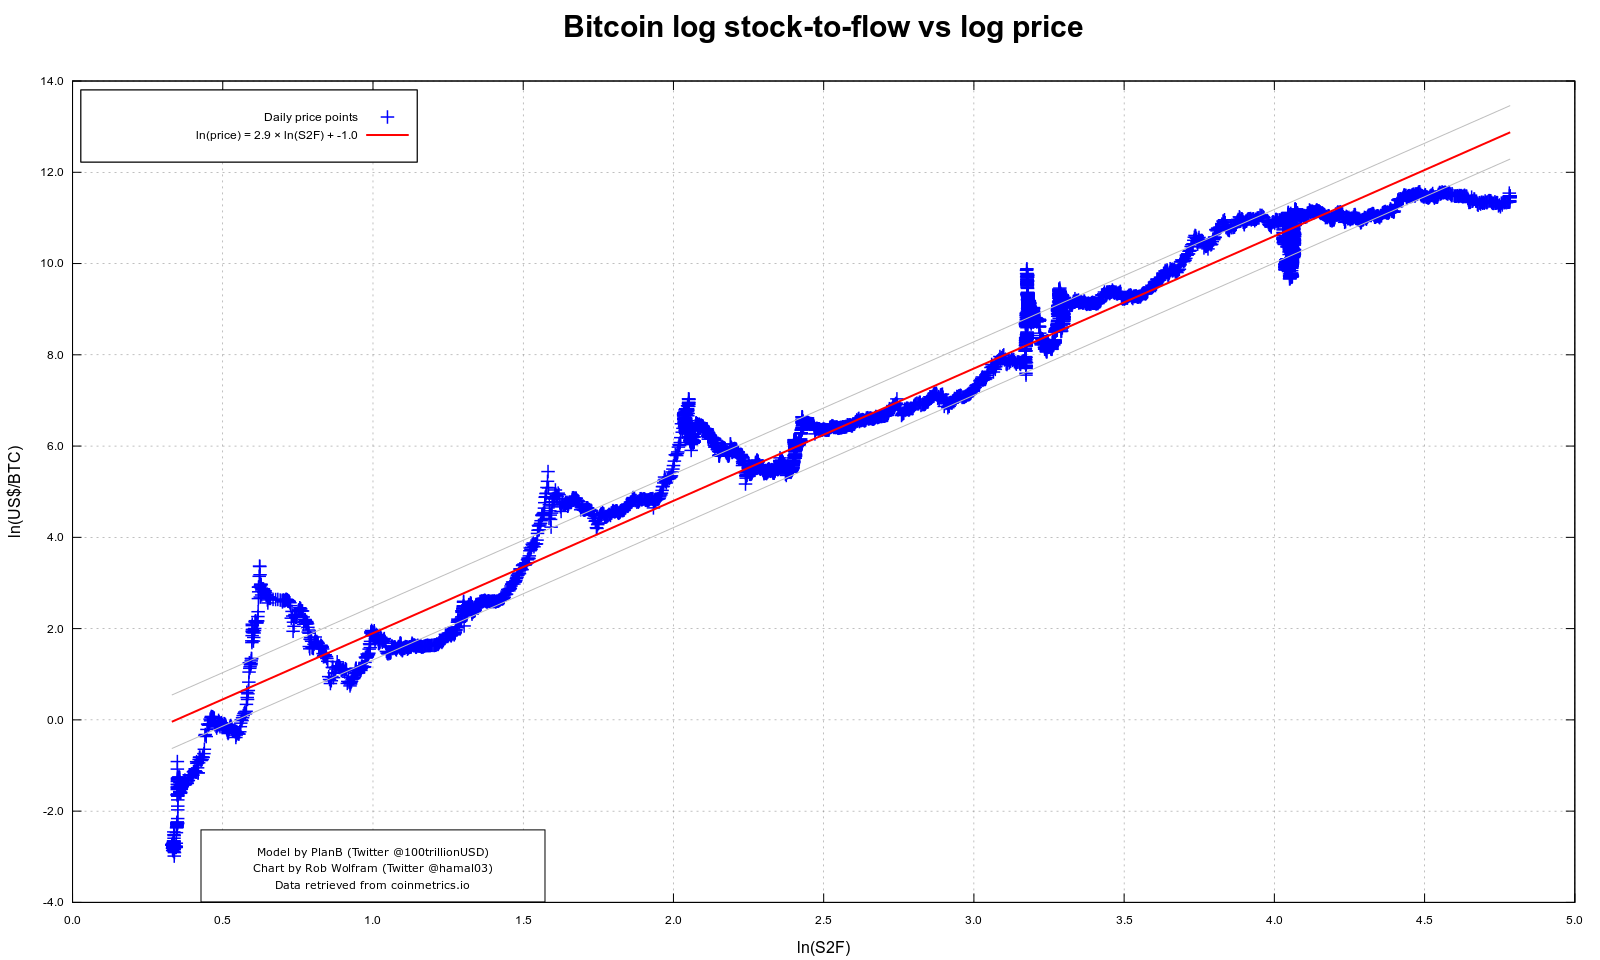
This page contains a chart showing the relation between the average US$ price of bitcoin (available from coinmetrics.io and Bitcoin's stock-to-flow ratio. The stock at a specified date is the number of bitcoins that are mined at that date and the flow is the number of coins in a year that lead to that stock. The division between both is the stock-to-flow ratio. There is a strong correlation between the logarithm of the stock-to-flow ratio and the logarithm of the price (see third graph).
These charts are updated daily.
The data analysis is done with a python script which produces data that is plotted with gnuplot. The code is availalable on Github.
All time price & stock-to-flow chart
The first chart shows the relation between the stock-to-flow and the price during the time that prices were available at coinmetrics.io. The grey line represents both the stock-to-flow ratio (denoted on the right Y-axis) and the predicted price in US dollars (on the left Y-axis). The dark blue area represents one standard error (2D version of standard deviation) from the predicted price and the light blue area represents two standard errors. The predicted price is extended into the future based on the parameters until Jan 1st 2027.
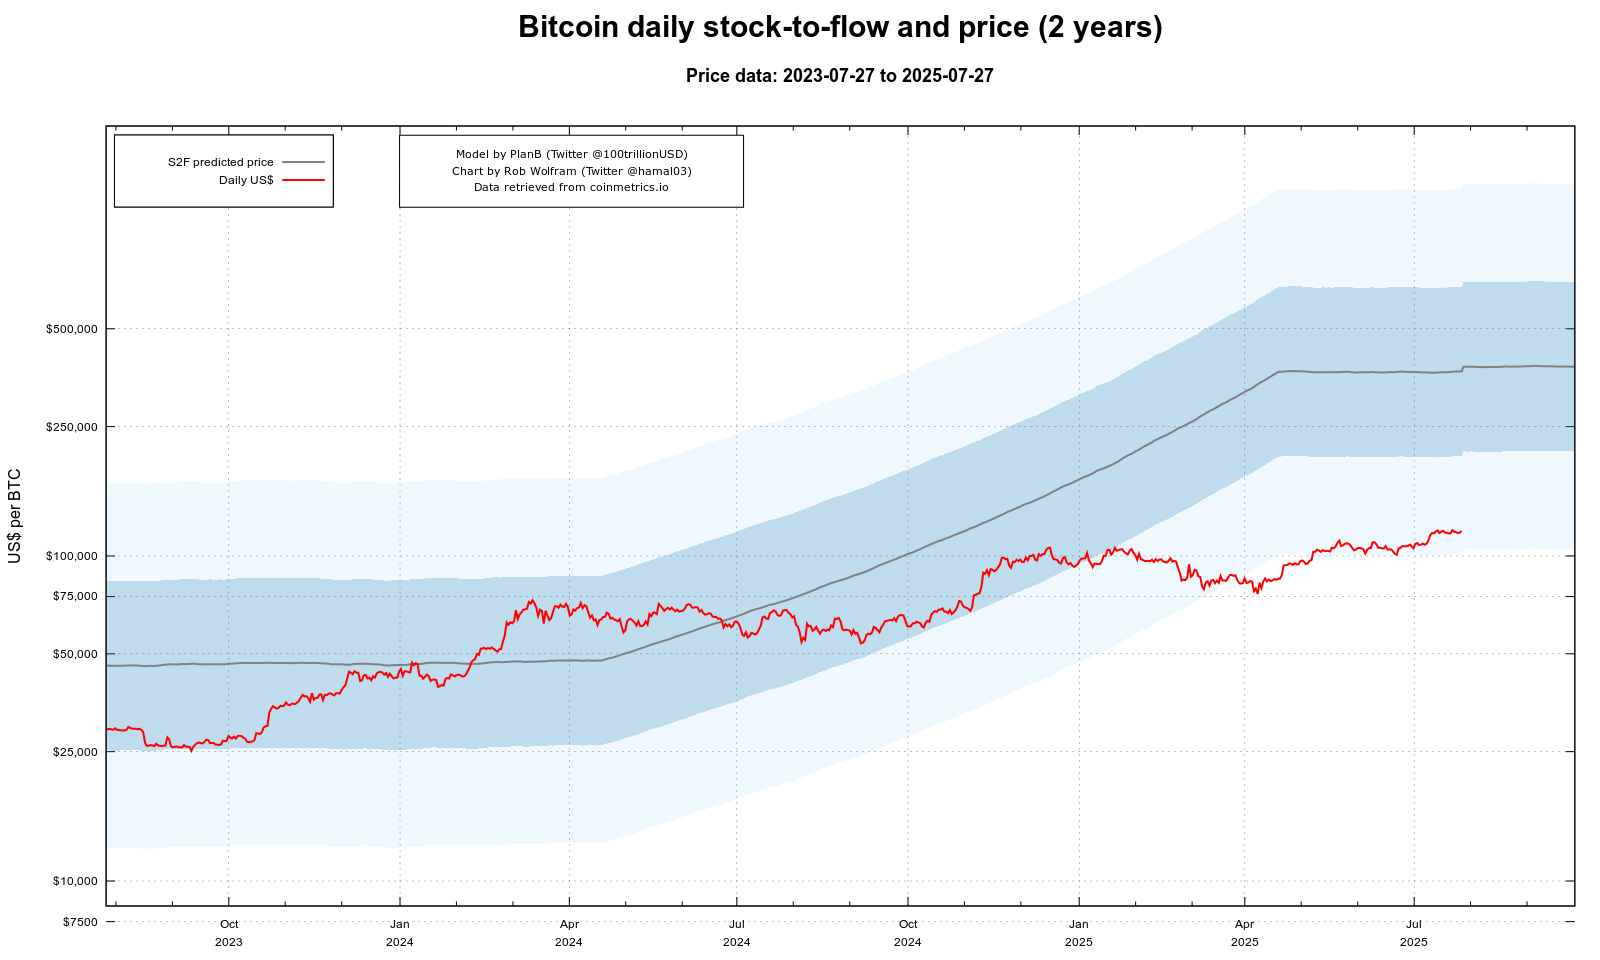
2-year detail chart
This chart is a detail of the last chart showing the last two years.
Linear regression on ln(S2F) and ln(price)
This chart shows the regression line on the data points with the logarithm of the stock-to-flow and the logarithm of the price in US dollars. The two grey lines denote addition and subtraction of one standard error.
Current data
Reading data from a logarithmic scale isn't trivial, so here are the values for the latest data point (current date refers to the date of that point).
| Current date: | 2026-02-09 |
| Current price: | $70244.1 |
| Predicted price: | $330375.21 |
| Predicted × 1SE: | $621859.78 |
| Predicted ÷ 1SE: | $175518.31 |
| Predicted × 2SE: | $1243719.56 |
| Predicted ÷ 2SE: | $87759.16 |


