Daily updated charts of Bitcoin's coinbase transaction value
Posted on Fri 27 March 2020 in misc
NOTE: This page should not be interpreted as financial advice
The 2020 "halvening" is approaching fast. When Bitcoin's block number 630,000 will be mined, the number of new coins that are awarded to the miner is cut in half from 12.5 to 6.25. It will be the third time that this happens and I wondered what effect it had on the dollar value that was awarded to the miners in the past and if there was a "miner capitulation", which should be visible in the approximate hash rate.
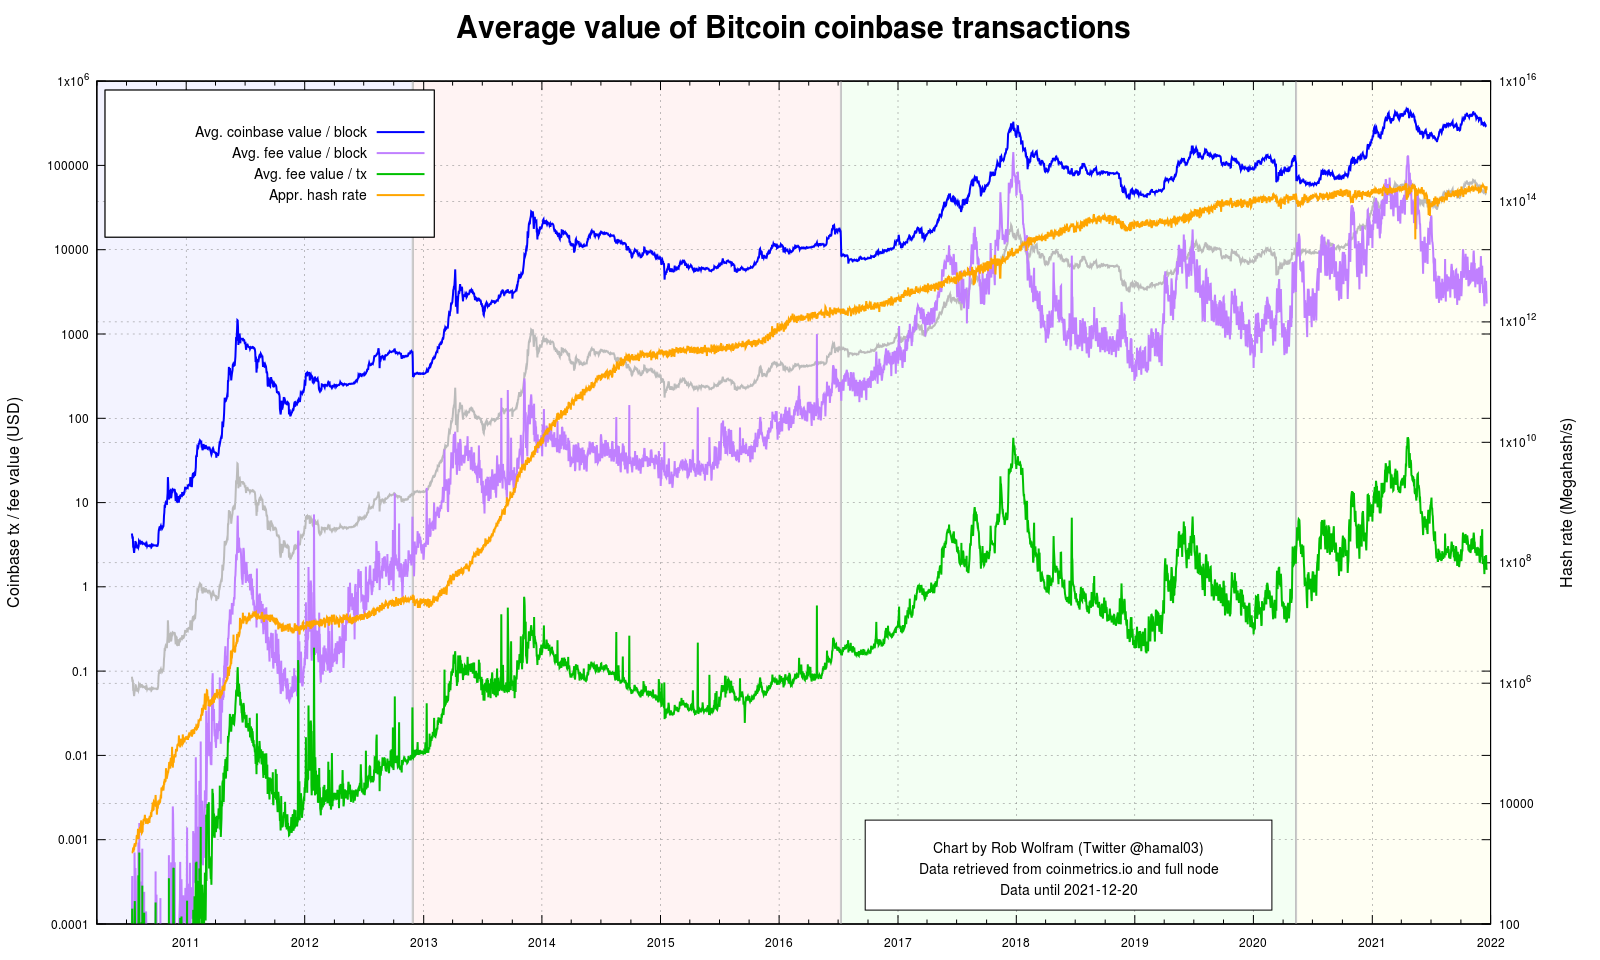
The image below presents a daily average of the dollar value of the "coinbase" transaction (i.e., the newly rewarded bitcoins and the total transaction fee), the daily average of the fee only (per block and per transaction) and the approximate daily hash rate (based on the block's last difficulty, adjusted by the nuber of blocks mined that day).
The times between the various "halvenings" are colored differently and the next halvening is estimated based on 144 blocks per day. The current dollar price per bitcoin is added unlabeled and that nicely shows when the total fees per block exceeded a bitcoin.
The graph will be updated daily and I will even keep it around after the 2020 halvening.
The data for this graph has two sources. The daily price information is retrieved from coinmetrics.io and the block information (median time, height, number of transactions and btc value of the coinbase transaction) are retrieved from my own full node. I use the median time of the block because unlike the block timestamp, this is guaranteed to increase with every block.
The scripts to fetch and aggregate the data and create the input files for creating the chart are made available at Gitlab.